
ShapBPT interactive demo
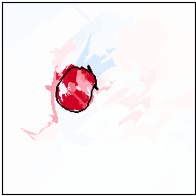
Which regions of an image make a ResNet-50 predict its class? Both explanations compute a Shapley value φ for every region with the same budget of model evaluations, but ShapBPT splits the image along a data-aware Binary Partition Tree, while ShapAA splits it into axis-aligned rectangles. Red regions raise the predicted probability, blue ones lower it. Hover over a region to see its value.
Image
View
 Which explanation helps you most?
Help us evaluate ShapBPT: rank four explanation maps per image, anonymously, in about 5 minutes.
Take the user study →
Precomputed with shap_bpt (see demo_compute/); the page only looks values up.
Paper: ShapBPT on arXiv.